Societal Impact of Gas Flaring
Initial Results

In partnership with Microsoft’s AI for Earth, NBI Inc. led a project focused on the community impact of gas flaring. This work showcases the use of MS Planetary Computer in supporting the positive societal impact and justice related to climate change.
Overview
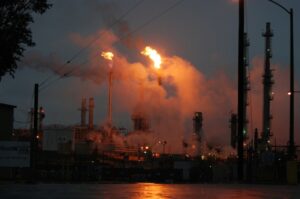
Gas flaring is the burning of natural gas associated with oil extraction, which introduces toxic pollutants such as sulfur dioxide and other hydrocarbons into the environment. While its potential impact on the environment and generation of greenhouse emissions that contribute to global climate change is understood, little research has been done into the potential impact of these emissions on the health of populations living nearby. With recent advances in machine learning and cloud computing, it is now possible to use satellite observations to link flaring volumes for specific sites and locations to possible harmful human health outcomes.
Summary
By using basic, conservative assumptions about the efficiency of the burn, overlaying geographic crude source assumptions, modeling weather patterns, and a plume dispersion model, links between flaring emissions and possible adverse health outcomes can be made. The results indicate that even 10-minute exposures to flaring emissions can have serious potential health effects for those living near flaring sites.
Health Outcome Data
- An extensive review of the literature for 15 chemicals associated with gas flaring was undertaken (over 500 citations).
- A data set was coalesced containing minimum risk, permissible, recommended, and exposure guideline levels for acute, intermediate, and chronic time periods, and the resultant health hazards when exceeded.
- These risk levels were compiled from the Environmental Protection Agency, the Agency for Toxic Substances and Disease Registry – US Department of Health and Human Services, the Occupational Health and Safety Administration, the National Institute for Occupational Safety and Health (NIOSH), and the American Conference of Governmental Industrial Hygienists.
Methodology for Determining Gas Flare Volumes from Satellite Data
- The World Bank’s Global Gas Flaring Reduction Partnership (GGFR), in partnership with the U.S. National Oceanic and Atmospheric Administration (NOAA) and the Payne Institute for Public Policy at the Colorado School of Mines, has developed global gas flaring estimates based upon observations from satellites launched in 2012 and 2017.
- The advanced sensors of this satellite detect the heat emitted by gas flares as infrared emissions at global upstream oil and gas facilities.
- The Colorado School of Mines and GGFR quantify these infrared emissions and calibrate them using country-level data collected by a third-party data supplier, Cedigaz, to produce robust estimates of global gas flaring volumes.
- Satellite flare volume estimate = 0.0281 x VIIRS radiant heat (adjusted for non-linearity of larger producing sites). The Visible Infrared Imaging Radiometer Suite (VIIRS) instrument collects visible and infrared imagery and global observations of land, atmosphere, cryosphere, and oceans.
Flaring Sensor Data
- SkyTruth Flaring Records (clustered flaring sites derived from VIIRS Night Fire ) and actual VIIRS VNF data
- Weather Data from Microsoft NOAA Global Forecast System and/or NOAA Integrated Surface Database
- Pollutants Data Sentinel-5P
Equations for Estimating Flaring Gas Emissions Types
- Emission estimates from flaring gas in elevated flares are predicted by generating mass balance equations for various flaring conditions.
- This model depends largely on the number that precedes the formula for chemical species involved in the chemical reactions and is termed the stoichiometric coefficient.
- Mass balance in combustion analysis is central to determining flare combustion efficiency (Prateep et al., 2012, Johnson, 2008) and hence, flares emissions.
- Sonibare and Akeredolu (2004) investigated seven possible reactions (conditions) for the flaring of natural gas using mass balance equations.
- Six of these were conditions that favor incomplete combustion.
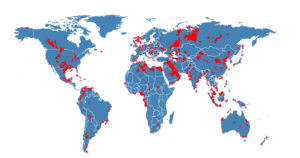
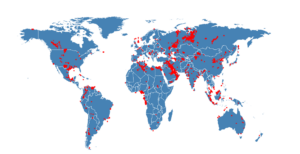
Global Flaring Sites Detected
Acute Exposure Guideline Levels (AEGL)
AEGL-1 is the airborne concentration above which it is predicted the general population, including susceptible individuals, could experience notable discomfort, irritation, or certain asymptomatic non-sensory effects. However, the effects are not disabling and are transient and reversible upon cessation of exposure.
AEGL-2 is the airborne concentration of a substance above which it is predicted that the general population, including susceptible individuals, could experience irreversible or other serious, long-lasting adverse health effects or an impaired ability to escape.
AEGL-3 is the airborne concentration of a substance above which it is predicted that the general population, including susceptible individuals, could experience life-threatening health effects or death.
Site Daily Pollution over AEGL Limits – Number of Occurrences
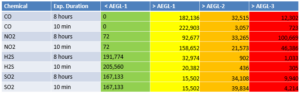
Assumes distance of 1 km from flaring site
Frequency of Flaring Activity that exceeds OSHA/NIOSH Permission Exposure Level
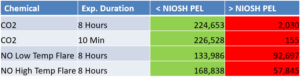
Assumes distance of 1 km from flaring site
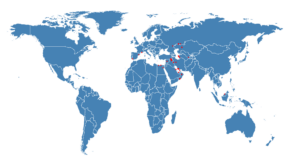
Locations with Nitrogen Dioxide Emissions in Excess of 10 min Over AEGL-3 Thresholds for One or More Days
Locations with Carbon Monoxide Emissions in Excess of 10 min Over AEGL-3 Thresholds for One or More Days
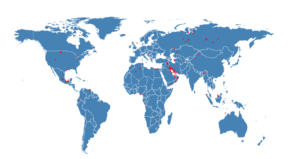
Locations with Hydrogen Sulfide Emissions in Excess of 10 min Over AEGL-3 Thresholds for One or More Days
Calibration to the Total Volume
- Reported total flaring activity provides a measure of calibration and validation.
- However, based on measured radiant heat, duration, frequency, etc. of observed sites, there should be more flaring activity than is being reported.
- A possible explanation is some countries are over or under-reporting flaring activity (the problem is most acute in Venezuela, Iran, Iraq, Kazakhstan).
Analysis of Health Effects of Natural Gas Flaring – GitHub Repository
https://github.com/nsiteam/Flaring
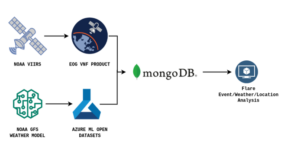
Remote-Sensing Data is obtained from 2 primary sources.
- Flaring event data is obtained from the VNF product produced by the Colorado School of Mines EOG
- Weather data is obtained from Microsoft’s AzureML Opendatasets
The data is ingested into a MongoDB database into a VnfEvent object and a Gfs object. The code examples in this repo are in Kotlin, but MongoDB bindings for most languages are available. Details of the data object structures are under the src/main/kotlin/dao folder.
There are 2 example analyses. AppMaxExposure shows an example of calculating methane equivalents for individual flaring events and using a simple Gaussian dispersion model to calculate worst-case contaminant concentrations along the primary wind direction at a distance of 1km from the source. AppVnfGeoExample shows an example of using country shapefile boundaries to assign flaring events by country.
Additional References:
